
1 day ago
Latest
Showing posts with label Chart Pattern. Show all posts
Showing posts with label Chart Pattern. Show all posts
OCBC and F&N
Posted by InvestorTrader
on
Thursday, May 27, 2010
, under
Chart Pattern,
FandN,
OCBC
|
comments (0)
Weekly chart for OCBC shows a double top pattern formation and the daily chart went under the 200MA yesterday, tested it today and had a huge sell down at the close - ie not a good sign, especially since STI was up 1.7% today. It is now at its support point and if this does not hold, it may head towards its next significant support at 7.44. But then again, if the market sentiments are ok tomorrow, then a quick 1-2 day opportunity counter trend trade may be possible.

F&N looks to be in a symmetrical triangle formation and it is nearing its apex. Though it is generally a continuation pattern, ie should be breaking upwards, it may also break down if the market goes bearish.
CityDev, Ezion, SIA and Capitamall
Posted by InvestorTrader
on
Friday, May 14, 2010
, under
Capitamall,
Chart Pattern,
CityDev,
Ezion,
SIA,
Swing Trading
|
comments (0)
As mentioned yesterday, CityDev and Ezion may present shorting opportunities and it did arise today. CityDev candlestick today is an engulfing bear, meaning there could still be more downside. But still need to watch out for the 200MA being the support and also that the volume today is lower than yesterday's.

Another counter put on watch list for shorting is SIA.
Though current climate may present slightly more shorting opportunities, there are still some counters showing strength. One such counter is Capitamall which had been mentioned a few times previously. It had tested the 1.99 a couple times recently and it finally broke that resistance with volume today. If it manages to stay above this, then it is likely to head towards the next resistance of 2.14.
SIA Engg and GMG
Posted by InvestorTrader
on
Sunday, May 2, 2010
, under
Chart Pattern,
GMG,
SIA Engg,
Swing Trading
|
comments (0)
SIA Engg broke out of the symmetrical triangle pattern last Friday and if it can stay above the down-trend line for another day or two, there may be more upside.
Still keeping an eye on GMG as it is in the Swing trade buy zone and it has also bounced off the 50% Fibo retracement level.
Capitamall, GMG and Chemoil
Posted by InvestorTrader
on
Wednesday, April 28, 2010
, under
Capitamall,
Chart Pattern,
Chemoil,
GMG
|
comments (0)
Capitamall broke out of ascending triangle yesterday and stayed up above resistance of 1.89 for a 2nd second day. More upside likely but need to be cautious given that Dow, Nasdaq and S&P500 is currently down by more than 1% (at point of post) due to fear of what's happening in Greece. 
A couple of counters to watch for potential swing trade are GMG and Chemoil. GMG is now on the 20MA. Trigger at 0.225 and stop at 0.200.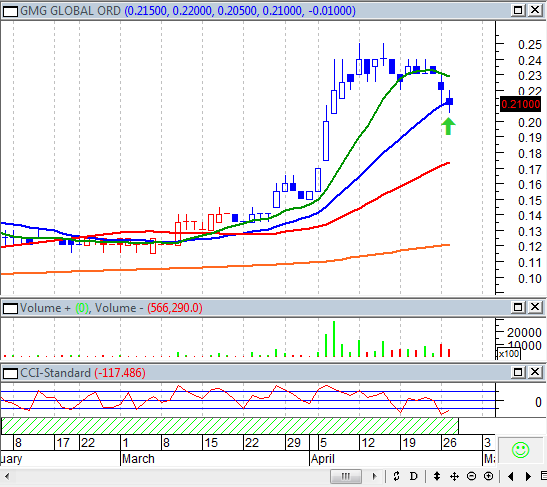
Trigger for Chemoil at 0.41 and stop at 0.39.
Jaya Holdings
Jaya Holdings looking interesting with it ascending triangle pattern. If it stays above 0.715, upside potential looks good, as shown in weekly chart.


